Creating Effective Ad Banner Animations for Web
Explore timing, easing, and attention-grabbing techniques that drive clicks with proven banner animation strategies.
Read ArticleAnimation drives engagement, but you can’t improve what you don’t measure. We’re diving into the metrics that matter, the tools that work, and how to connect animation performance directly to campaign results.


Author
FrameFlow Motion Editorial Team
Written by the FrameFlow Motion editorial team, focused on practical, clearly explained guidance for motion design and social media animation.
Most animation gets published and forgotten. Views happen, engagement spikes, and then… nobody knows why. It’s like throwing a campaign out into the void without a tracker attached. But here’s the thing: animation performance isn’t mysterious. It’s measurable, predictable, and absolutely worth tracking.
The difference between animation that converts and animation that underperforms isn’t always talent—it’s data. When you understand which elements drive attention, which moments cause drop-off, and which techniques keep viewers watching, you can refine everything that comes next.
Average attention span in social video
Higher engagement with motion design
More likely to convert with animations
You’ve got to measure the right things. Not everything that looks impressive on a dashboard actually tells you what’s working. Focus on these core metrics first:
Don’t get lost in vanity metrics like total impressions. They don’t tell you anything about quality or actual performance. Instead, dig into the numbers that reveal viewer behavior.
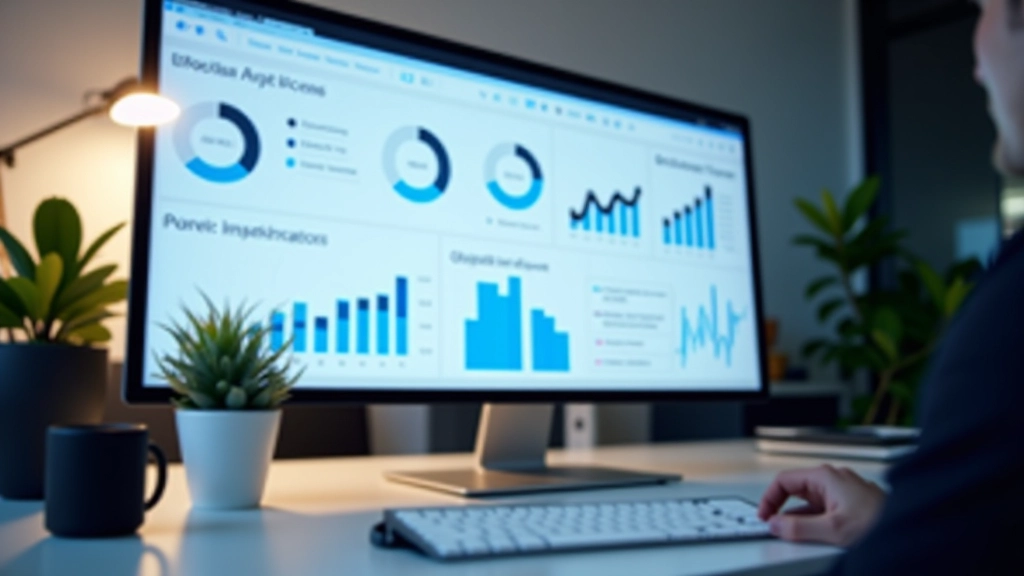

Here’s where most animators miss the mark: you can’t just feel if your animation timing is right. You need to see where viewers actually focus their attention.
Heatmap data from platforms like TikTok, Instagram, and YouTube shows exactly which moments in your animation grab attention and which ones fall flat. You’ll notice patterns: rapid movement captures attention in the first frame, slow reveals lose viewers around the 2-second mark, and abrupt color changes create micro-moments of engagement.
Test different easing curves—ease-in vs. ease-out vs. cubic-bezier. Run A/B tests with 3-frame variations. What you’re looking for is the sweet spot where the animation feels natural but still commands attention. That’s usually somewhere between 400-800 milliseconds for most motion sequences.
And don’t skip the numbers. If your animation at 600ms converts 23% better than the 400ms version, you’ve just found a repeatable pattern. Document it. Use it in future campaigns.
Learning Note: Individual animation performance outcomes vary based on platform, audience, and industry context. The metrics and techniques discussed here are educational guidelines. What works best for your specific campaigns should always be validated through your own testing and analytics.
You don’t need to buy expensive software. Most of the best tools for measuring animation performance are either built into platforms or cost very little. Here’s what we use:
YouTube Analytics, Instagram Insights, TikTok Creator Dashboard. They’re free, they’re detailed, and they track viewer behavior at the frame level. You can see drop-off moments, replay behavior, and engagement spikes.
If your animation links to a website, GA4 tracks user journey, bounce rate, and conversion funnel. Connect the animation engagement back to actual business outcomes.
Optimize or Convert let you run side-by-side tests of animation variations. You’ll get statistical significance, not just gut feelings about what’s working.


Don’t just measure randomly. Build a system. Here’s what we recommend:
Here’s what happens when you actually track animation performance: you stop guessing. You see which techniques work, which don’t, and why. That’s not just better for your animations—it’s better for your entire campaign strategy.
You’ll notice your view-through rates improving because you’re testing timing. Your engagement rates climbing because you’ve identified which motion sequences actually capture attention. Your conversion rates rising because you’ve connected animation performance directly to business outcomes.
The animators and marketers who measure their work aren’t just creating prettier ads. They’re creating smarter ones. And smart always outperforms pretty.
Start small: Pick one metric (VTR or engagement rate), measure your next animation, and establish a baseline. Then test one variation. You don’t need perfection—you need data. Everything improves from there.
Deepen your understanding of motion design for advertising
Explore timing, easing, and attention-grabbing techniques that drive clicks with proven banner animation strategies.
Read Article
Master platform-specific motion requirements. Learn vertical format constraints, attention mechanics, and viral animation techniques.
Read Article
Create efficient animation workflows with modular templates. Speed up production while maintaining quality across campaigns.
Read Article